Available in versions: Dev (3.20) | Latest (3.19) | 3.18 | 3.17 | 3.16 | 3.15 | 3.14 | 3.13 | 3.12 | 3.11 | 3.10
This documentation is for the unreleased development version of jOOQ. Click on the above version links to get this documentation for a supported version of jOOQ.
jOOQ and JavaFX
Applies to ✅ Open Source Edition ✅ Express Edition ✅ Professional Edition ✅ Enterprise Edition
One of the major improvements of Java 8 is the introduction of JavaFX into the JavaSE. With jOOQ and Java 8 Streams and lambdas, it is now very easy and idiomatic to transform SQL results into JavaFX XYChart.Series or other, related objects:
Creating a bar chart from a jOOQ Result
As we've seen in the previous section about jOOQ and Java 8, jOOQ integrates seamlessly with Java 8's Streams API. The fluent style can be maintained throughout the data transformation chain.
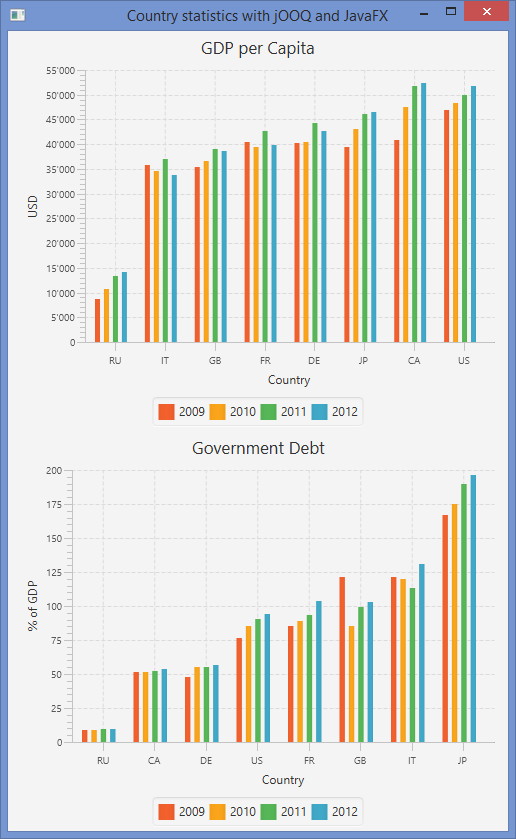
In this example, we're going to use Open Data from the world bank to show a comparison of countries GDP and debts:
DROP SCHEMA IF EXISTS world;

CREATE SCHEMA world;

CREATE TABLE world.countries (
  code CHAR(2) NOT NULL,
  year INT NOT NULL,
  gdp_per_capita DECIMAL(10, 2) NOT NULL,
  govt_debt DECIMAL(10, 2) NOT NULL
);

INSERT INTO world.countries
VALUES ('CA', 2009, 40764, 51.3),
       ('CA', 2010, 47465, 51.4),
       ('CA', 2011, 51791, 52.5),
       ('CA', 2012, 52409, 53.5),
       ('DE', 2009, 40270, 47.6),
       ('DE', 2010, 40408, 55.5),
       ('DE', 2011, 44355, 55.1),
       ('DE', 2012, 42598, 56.9),
       ('FR', 2009, 40488, 85.0),
       ('FR', 2010, 39448, 89.2),
       ('FR', 2011, 42578, 93.2),
       ('FR', 2012, 39759,103.8),
       ('GB', 2009, 35455,121.3),
       ('GB', 2010, 36573, 85.2),
       ('GB', 2011, 38927, 99.6),
       ('GB', 2012, 38649,103.2),
       ('IT', 2009, 35724,121.3),
       ('IT', 2010, 34673,119.9),
       ('IT', 2011, 36988,113.0),
       ('IT', 2012, 33814,131.1),
       ('JP', 2009, 39473,166.8),
       ('JP', 2010, 43118,174.8),
       ('JP', 2011, 46204,189.5),
       ('JP', 2012, 46548,196.5),
       ('RU', 2009,  8616,  8.7),
       ('RU', 2010, 10710,  9.1),
       ('RU', 2011, 13324,  9.3),
       ('RU', 2012, 14091,  9.4),
       ('US', 2009, 46999, 76.3),
       ('US', 2010, 48358, 85.6),
       ('US', 2011, 49855, 90.1),
       ('US', 2012, 51755, 93.8);
Once this data is set up (e.g. in an H2 or PostgreSQL database), we'll run jOOQ's code generator and implement the following code to display our chart:
CategoryAxis xAxis = new CategoryAxis();
NumberAxis yAxis = new NumberAxis();
xAxis.setLabel("Country");
yAxis.setLabel("% of GDP");

BarChart<String, Number> bc = new BarChart<String, Number>(xAxis, yAxis);
bc.setTitle("Government Debt");
bc.getData().addAll(

    // SQL data transformation, executed in the database
    // -------------------------------------------------
    DSL.using(connection)
       .select(
           COUNTRIES.YEAR,
           COUNTRIES.CODE,
           COUNTRIES.GOVT_DEBT)
       .from(COUNTRIES)
       .join(
           table(
               select(COUNTRIES.CODE, avg(COUNTRIES.GOVT_DEBT).as("avg"))
               .from(COUNTRIES)
               .groupBy(COUNTRIES.CODE)
           ).as("c1")
       )
       .on(COUNTRIES.CODE.eq(field(name("c1", COUNTRIES.CODE.getName()), String.class)))

       // order countries by their average projected value
       .orderBy(
           field(name("avg")),
           COUNTRIES.CODE,
           COUNTRIES.YEAR)

       // The result produced by the above statement looks like this:
       // +----+----+---------+
       // |year|code|govt_debt|
       // +----+----+---------+
       // |2009|RU  |     8.70|
       // |2010|RU  |     9.10|
       // |2011|RU  |     9.30|
       // |2012|RU  |     9.40|
       // |2009|CA  |    51.30|
       // +----+----+---------+

    // Java data transformation, executed in application memory
    // --------------------------------------------------------

       // Group results by year, keeping sort order in place
       .fetchGroups(COUNTRIES.YEAR)

       // Stream<Entry<Integer, Result<Record3<BigDecimal, String, Integer>>>>
       .entrySet()
       .stream()

       // Map each entry into a { Year -> Projected value } series
       .map(entry -> new XYChart.Series<>(
           entry.getKey().toString(),
           observableArrayList(

               // Map each country record into a chart Data object
               entry.getValue()
                    .map(country -> new XYChart.Data<String, Number>(
                         country.getValue(COUNTRIES.CODE),
                         country.getValue(COUNTRIES.GOVT_DEBT)
                    ))
           )
       ))
       .collect(toList())
);
The above example uses basic SQL-92 syntax where the countries are ordered using aggregate information from a derived table, which is supported in all databases. If you're using a database that supports window functions, e.g. PostgreSQL or any commercial database, you could have also written a simpler query like this:00
DSL.using(connection)
   .select(
       COUNTRIES.YEAR,
       COUNTRIES.CODE,
       COUNTRIES.GOVT_DEBT)
   .from(COUNTRIES)

   // order countries by their average projected value
   .orderBy(
       DSL.avg(COUNTRIES.GOVT_DEBT).over(partitionBy(COUNTRIES.CODE)),
       COUNTRIES.CODE,
       COUNTRIES.YEAR)
   .fetch()
   ;

return bc;
When executed, we'll get nice-looking bar charts like these:
The complete example can be downloaded and run from GitHub:
https://github.com/jOOQ/jOOQ/tree/main/jOOQ-examples/jOOQ-javafx-example
Feedback
Do you have any feedback about this page? We'd love to hear it!